Sanborn Fire Insurance Maps
Have you ever wished for a time machine?
Though not quite a portal to another era, Sanborn Maps are a fantastic alternative for imaginative historians.
Between 1867 and 1970 the Sanborn Map Company created hundreds of thousands of maps of more than 12,000 American towns. The drawings captured an extensive array of information about each property. Companies used the data to assess the risk of structural loss due to fire and rate insurance accordingly.
America grew by leaps and bounds after the Civil War. The opportunities presented by agricultural expansion, railroad construction and industrialization drew millions of immigrants to the USA, all of which resulted in a residential and commercial building boom.
Sanborn’s surveyors created to-scale maps of a community after each period of growth. The maps recorded building footprints and relative construction details of each structure. Structural details like iron storefronts, steel beams, porches and sometimes window and door locations were drawn. Construction material was indicated with color; structures outlined in yellow were built of wood, blue represented stone and red indicated brick.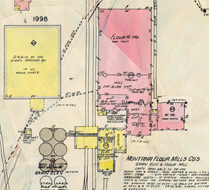
The maps provided information relative to their purpose of assessing fire insurance risk. Building footprints were shown relative to property lines and the distance between two buildings was noted. The surveyors recorded the presence of related public utilities like water pipes and fire hydrants. The location of fire stations, and a property’s proximity to the fire station, was also indicated.
The production of the maps reveals an efficiency of standardization in formatting and notation. The maps included a cover page which showed the entire community and a key for reading the map. The cover map was numbered to indicate subsequent detail sheets of each area surveyed. An index guided users to the detail sheet depicting commercial, industrial and institutional properties. The Sanborn Map Company used the same key for every map they created, enabling insurance agents to quickly interpret the visual information provided on the map.
The Sanborn Company first mapped Bozeman in November of 1884, 18 months after the arrival of the Northern Pacific Railway. The maps were updated in January 1889, on the eve of Montana’s statehood. Due to Bozeman’s rapid pace of development, Sanborn’s surveyors returned in July 1890 and November 1891. The 1891 drawings included the City Hall and Opera House constructed on the south west corner of East Main Street and Rouse Avenue, and detailed the opera hall’s balcony.
Sanborn created comprehensive new maps for Bozeman in January 1904, in September 1912 and September 1927. In August 1943 the 1927 map was updated by cutting and pasting new building footprints over the older version. The last update in the late 1950’s showed the Field House on the Montana State College campus.
The Sanborn maps covered any structure which required fire insurance, or which could affect the fire risk to surrounding properties. Commercial sites like a lumber mill were shown including the lumber piled in the yard to dry. An industrial power source, be it a steam engine, hydropower or electricity, was indicated, as this equipment could be the source of a fire.
Bozeman’s 1889 Sanborn Map shows the Valley Mills, owned by Nelson Story and Co. Located two and a half miles north of Bozeman’s City Hall, the mill became one of the largest employers in the state.
The drawing indicates that a three story central tower housed the milling equipment. Notes on the map listed mechanical equipment including turbine wheels, a conveyor belt system, rolls to crush the wheat kernels into flour, purifiers and bolting reels.
The map detailed landscape features like the log retaining wall supporting the ditch which brought water from the East Gallatin across the Story Hills bench and past the Mill. The water then moved through a three inch iron underground pipe to power the grain mill. The map indicated that after powering the mill, the water left the building to the west and rejoined the East Gallatin River. The Northern Pacific Railway spur line which ran from the Main Line near Front Street was also shown.
The surveyor provided information about the mill’s operation which impacted the property’s fire rating. The map notes the presence of a night watchman, the lights as kerosene, water power and the presence of 2 hydrants and 50 feet of 2 inch in diameter fire hose on each floor. Curiously, the notation included the presence of “hand grenades on each floor,” though the purpose of grenades in fire protection is unknown.
The 1891 Sanborn map of Story Mill was used for insurance purposes after the complex experienced a fire in August of 1901. The next Sanborn, in 1904, noted that the Story Mill complex was “being built- to have water power.” The milling structure remained in place, with a warehouse constructed to the north and a new grain elevator with a capacity of 90,000 bushels of wheat to the west along the NP Rail spur.
By 1912 the mill was expanded to the north, to include a flour warehouse. A combination of power sources was shown as well. Water power continued to be used, but the map noted the presence of a 100 horsepower motor as well.
The grain elevator storage was expended in 1927. The map showed the presence of six new grain elevator towers, built of reinforced concrete and “fireproof,” with a capacity of 250,000 bushels of wheat. The surveyor again noted operational practices for Story Mill, including: “capacity 1,000 bushels in 24 hours. Runs day and night. Power water and electric; lights electric. Hot water, city water, night watchman, hourly rounds, hydrants and hose as shown.” The Sanborn map also showed the new access to the Milwaukee Railroad, which further improved Story Mill’s access to grain for processing and transportation for shipping wheat.
The final Sanborn map update, in the 1950’s, shows Story Mill as the complex stands today. A new warehouse added grain storage as well as additional steel grain bins.
All of the information in this article was deduced from the Sanborn Maps. Through the generosity of the Montana Historical Society, the Montana Sanborns are available digitally. Please contact the City of Bozeman’s Historic Preservation Officer, Courtney Kramer, for access information.
Courtney Kramer is a proud graduate of MSU’s History Department and serves as the City of Bozeman’s Historic Preservation Officer. She may be contacted at the City Planning Office, 406-582-2260 or via email at ckramer@bozeman.net. More information about Bozeman’s historic districts is available at www.preservebozeman.org
From the 11/13 Issue of Bozeman Magazine