Cash on Cash Versus Cap Rate
For those who invest in real estate or are looking to invest in real estate, there are certain key numbers that are useful to examine a potential investment’s return. Two of the most commonly used numbers to calculate rates of return are the Cap Rate (short for Capitalization Rate) and the Cash on Cash return. Let’s explore the differences between the two.
Across the country, Cap Rate is the most commonly used number to value real estate based on the income it generates. If one is planning to become a real estate investor, they really need to become familiar with how it works. Essentially, the cap rate is the rate of return if a property was purchased with all cash. To calculate cap rate, take the annual gross rents, subtract any expenses (excluding debt service or mortgage payments) and divide that by the purchase price.
For example, a 4-plex is listed for sale for $1 million. Each unit rents for $1800 per month, so there is a total annual gross rent of $86,400. The property has annual taxes of $7200, insurance of $1200, utilities of $150 per month, or $1800 annually, $2400 worth of lawn & snow maintenance, and management fees of $7000 annually. If we subtract all of the expenses from the gross rents, we’re left with $66,800 net income. This is often referred to as the NOI, or Net Operating Income. If we divide the $66,800 by the $1 million asking price, we see that this property has a cap rate of 6.68%.
The cap rate can also be used in reverse to hit a desired rate of return. If we look at the above example, lets assume our investor wanted a minimum of a 7% return. If we take the NOI of $66,800 and divide that by 7%, we see the investor would have to purchase the property for $954,000 to hit their desired 7% return.
As we discussed earlier, the cap rate doesn’t take mortgage payments or debt service into the equation. However, the cash on cash return does. Let’s go back to our previous example and assume the buyer is going to purchase the 4-plex using a 30-year conventional mortgage, which they have been able to obtain at 5.5%. Their lender requires 25% down on the loan, giving them a $250,000 equity position and a $750,000 loan. Their principle & interest payments would be $4,259 per month, or $51,108 annually. After subtracting that from the previous NOI, they’re left with a net after debt service of $15,692. If we divide that final net by their cash investment of $250,000, we see they have a cash on cash return of 6.3%.
The cash on cash return is very subjective to the terms of the financing. Shortening the length of the loan will decrease the cash return. Decreasing the interest rate paid to the bank will increase the cash return. In the same example, if the borrower were able to secure their financing at 5%, that would increase their cash on cash return to 7.4%.
Neither the cash on cash return nor the cap rate take property appreciation, tax benefits, or debt amortization into account, which all increase an investment’s actual rate of return.
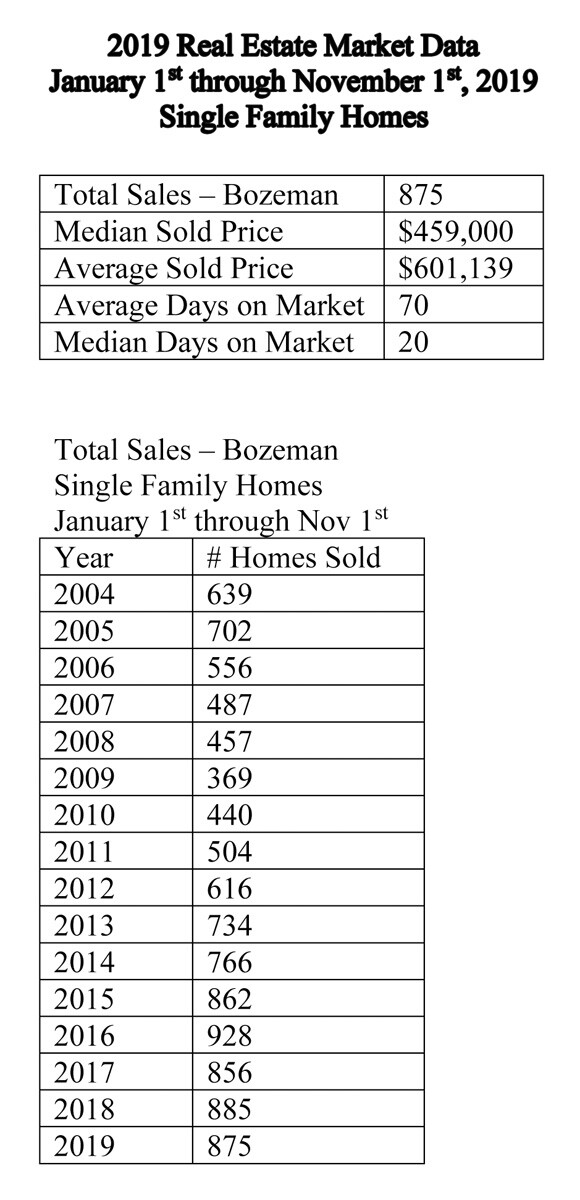
As usual, I have included the latest Real Estate statistics. In addition to the 875 homes sold in the first 10 months of 2019, another 177 home sales are currently pending or under contract as of the date of writing.
The included data reflects sales of homes in the greater Bozeman area, including Four Corners, Gallatin Gateway, Bridger Canyon, and Bozeman city limits. The data includes home sales reported through the local Big Sky Country MLS, and does not include private party sales, Condominiums, or Townhouses. 


