Bozeman Real Estate Market Report August 2021
We’re more than halfway through 2021. It’s been a busy year in Bozeman with businesses back open, tourism up, and life easing back towards normal. As we sit past the halfway mark, it’s time to look back and compare the first half of this year’s real estate market to past years.
It appears the laws of supply and demand have continued their effects on the Bozeman real estate market as prices have taken an historic rise while new listing inventory declined even further. From the first of the year through July 1, 591 single family homes were listed for sale in the greater Bozeman area, versus 649 homes listed during the same time last year and 722 in 2019. This represents a 10% decline from 2019 to 2020 and another 9% decline from last year to this year.
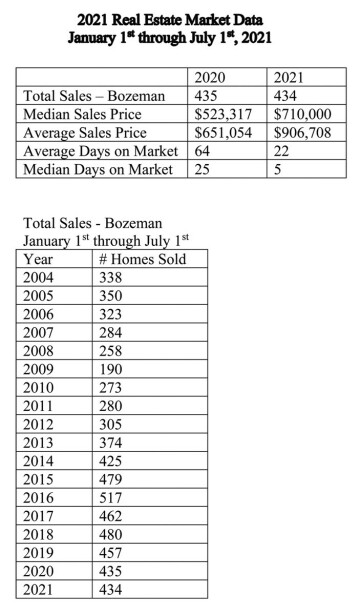
Looking at sales, even though there were fewer homes to sell, there were almost exactly the same number of transactions with 434 single-family homes selling during the first six months this year and 435 homes sold last year. Pending transactions are currently down. As of the date of writing, there are 156 home sales pending or under contract, compared to 230 homes at this same point last year, 182 in 2019 and 172 in 2018.
There are many ways to run the median sold price for Bozeman, depending on whether one includes condos, townhouses, and homes outside of city limits. Looking at just single-family homes both inside and outside city limits, the median sold price has taken a serious jump, climbing 35% from $523,317 last year to $710,000 this year. Restricting the data to single-family homes just inside city limits, we see an even larger increase of 41% from $477,750 last year to $676,800 this year.
Looking back further at that area including homes both inside and outside of city limits, from 2016 to 2017, median pricing for single-family homes rose steadily by 4.6% from $375,000 to $392,271. However, from 2017 to 2018, it took a nearly 12% rise to $439,325 for the first half of the year. It then rose 8.5% in 2019 to $476,500. 2020 saw a 9.8% increase to $523,317.
Again, looking at the area just inside city limits, median sold pricing from 2017 rose nearly 12% from $374,250 in 2017 to $418,130 in 2018. From 2018 to 2019, it rose another 4.5% to $437,000. 2020 saw a 9.3% increase over 2019 to $477,750.
After remaining relatively steady for a number of years, the month’s supply of homes for sale has dropped even lower. This is the number of months that it would take to sell the homes currently on the market. Starting around 2017, it has consistently hovered around 3 months. It’s now at 0.9 months, the lowest I’ve ever seen it. Some say that a “normal” or “healthy” market would have a 5-to-6-month supply of homes. Generally, anything below a 6-months’ supply is considered a seller’s market and anything above a 6-months’ supply is considered a buyer’s market.
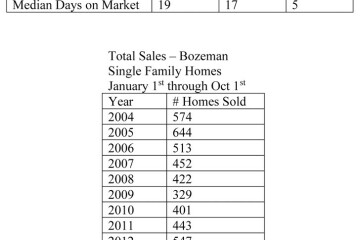
Not surprisingly, the number of days on market has also fallen considerably. The median days on market is now down to 5 days, down from 25 days last year, while the average days on market is at 22, down from 64 days last year.
The included data reflects sales of homes in the greater Bozeman area, including Four Corners, Gallatin Gateway, Bridger Canyon, and Bozeman city limits. The data includes home sales reported through the local Big Sky Country MLS, and does not include private party sales, Condominiums, or Townhouses.