Bozeman Real Esate Market Report
As we sit at the halfway point of 2022, there are many factors pushing and pulling the economy and housing markets. Inflation has remained high. Mortgage interest rates shot up quickly, then paused and seemed to come down slightly, then slowly ticked back up. The big question in the Real Estate space is: “Are things slowing down?” Let’s take a look at the numbers.
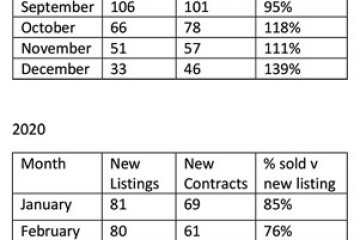
It can be beneficial to start on the supply side of things. The number of new listings has continued to decline over the past few years. From the first of the year through July 1 of this year, 584 single family homes were listed for sale in the greater Bozeman area, versus 592 homes during the same time last year, and 649 homes listed in the first half of 2020, which was down from 722 in 2019. These numbers represented a 10% decline from 2019 to 2020, and another 9% decline from 2020 to 2021. This year, while the number still declined, it was more modest, at around 1%.
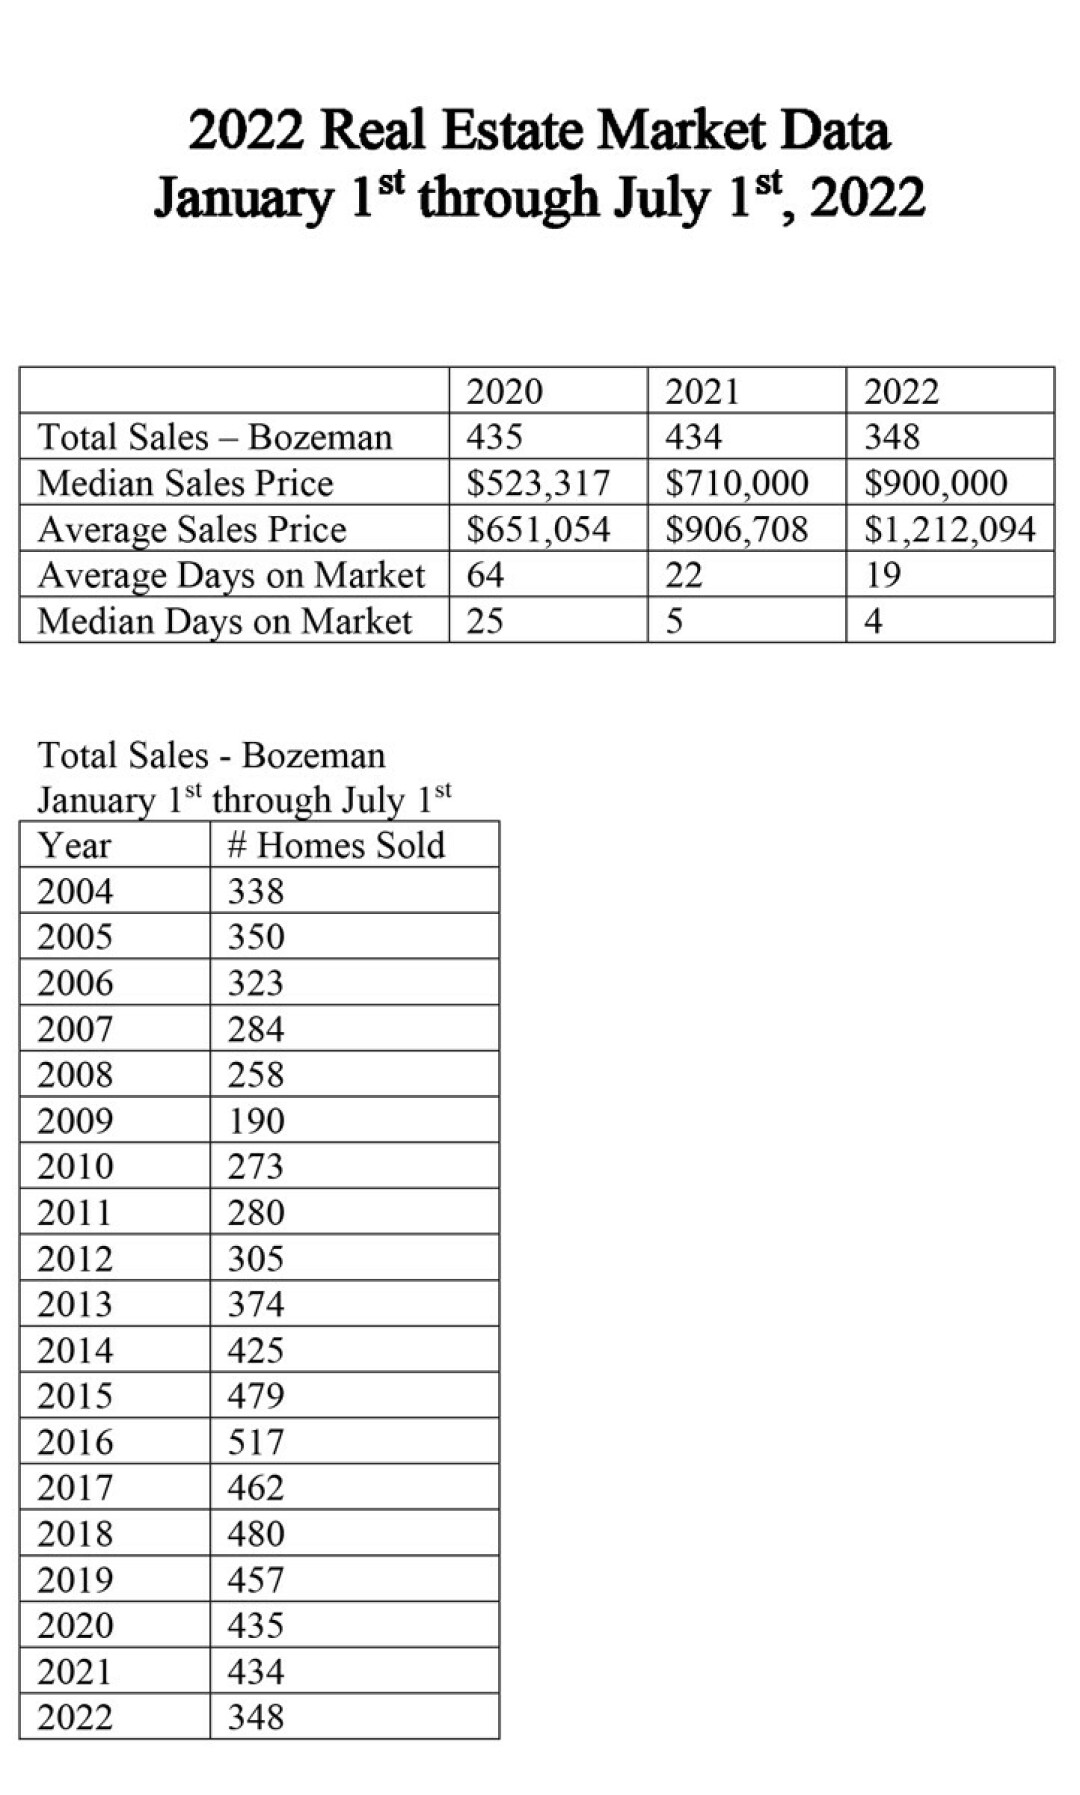
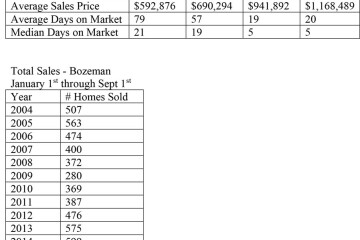
Sales numbers are currently down, with 348 single family homes sold in the first half of 2022, versus 434 sales in the first half of last year, and 435 homes sold in the first half of 2020. Pending transactions are also currently down. As of the date of writing, there are 100 home sales pending, versus 156 pending sales at this same time last year, 230 homes in 2020, and 182 in 2019.
There are many ways to run the median sold price for Bozeman, depending on whether you include condos, townhouses, and homes outside of city limits. Looking at just single-family homes both inside and outside city limits, the median sold price has continued to climb. For the first half of last year, median sold pricing climbed 35% from $523,317 in 2020 to $710,000 in 2021. This year, it has shown another 27% increase, to $900,000. Restricting the data to single-family homes just inside city limits, 2020 to 2021saw a 42% increase, from $477,750 to $676,800. This year, that number rose another 18% to $800,000.
Sales numbers in the condo & townhouse world tell a similar story. The number of new listings is down 5.7%, from 315 last year to 297 this year. Pending sales are down 23.2% from 280 last year to 215 this year. The number of closed sales is down 18.1%, from 248 last year to 203 this year. Median sold pricing is up 40.8%, from $412,000 last year to $580,000 this year.
After dropping to perhaps its lowest level ever last year, the month’s supply of homes for sale has inched up ever so slightly. This is the number of months that it would take to sell the homes currently on the market. Generally, anything below a six-month supply is considered a seller’s market, and anything above a six-month supply is considered a buyer’s market. Starting around 2017, it consistently hovered at around three months. Last year it fell to 0.9 months, but has crept up slightly to 1.3 months. Some say that a “normal” or “healthy” market would have a five to six month supply of homes.
The stats for days on market continue to remain low. Median days on market is now down to four days, down from five days last year and 25 days in 2020, while the average days on market is at 19, down from 22 days last year, and 64 days in 2020.
The included data reflects sales of homes in the greater Bozeman area, including Four Corners, Gallatin Gateway, Bridger Canyon, and Bozeman city limits. The data includes home sales reported through the local Big Sky Country MLS, and does not include private party sales, condominiums, or townhouses.